
Above Baseline Performance Revenue Optimization
A small fraction of customers drive the majority of revenue. The systems built to acquire them are tuned to miss them.
ABPRO is a system of attribution and reporting that lets teams steer into the power-law performance indicators that grow revenue — and stop chasing averages that won’t scale.
The problem
Averages describe a portfolio that doesn’t exist.
Recurring-revenue books follow a power law, not a bell curve. Plans built on the average account, the average lead or the average rep are steering by a number almost nothing in the book actually looks like.
01
A few accounts carry the book
A small share of customers produces most of the revenue. Reporting that only shows totals and averages hides exactly which ones they are and where they came from.
02
The cheapest leads cost the most
Sources with the lowest cost per lead can return revenue well below the value per sale the plan assumed. Volume KPIs reward them anyway.
03
Revenue arrives on its own clock
A month of spend pays back over many months. A single-period snapshot can’t tell you which months are working — cohorts tracked forward can.
How ABPRO works
Two sides of the business, joined by one number.
ABPRO connects the systems that spend money to the systems that record revenue, so every cohort can be read against what it actually cost.
INVESTMENT
Spend, isolated at the moment it’s made
Investment is split into its channels and locked to the month it occurred, fully loaded — ad spend, sales commission and the cost of running the team — then followed through the funnel from lead to closed-won.
REVENUE
Revenue, traced back to where it came from
A standardized statements backbone attributes recurring revenue to the cohort that produced it: left-to-right for each cohort’s lifetime, right-to-left for what landed in each month.
RRR
Rate of Revenue Return
What each cohort returns against its fully-loaded cost, read at fixed intervals and compared across cohorts to flag what’s running above or below baseline.
1 MONTH3 MONTHS6 MONTHS12 MONTHS
Reporting views
Built to be read at the cohort level.
Every client site carries the same core set of views, so the same questions get answered the same way across the whole portfolio.
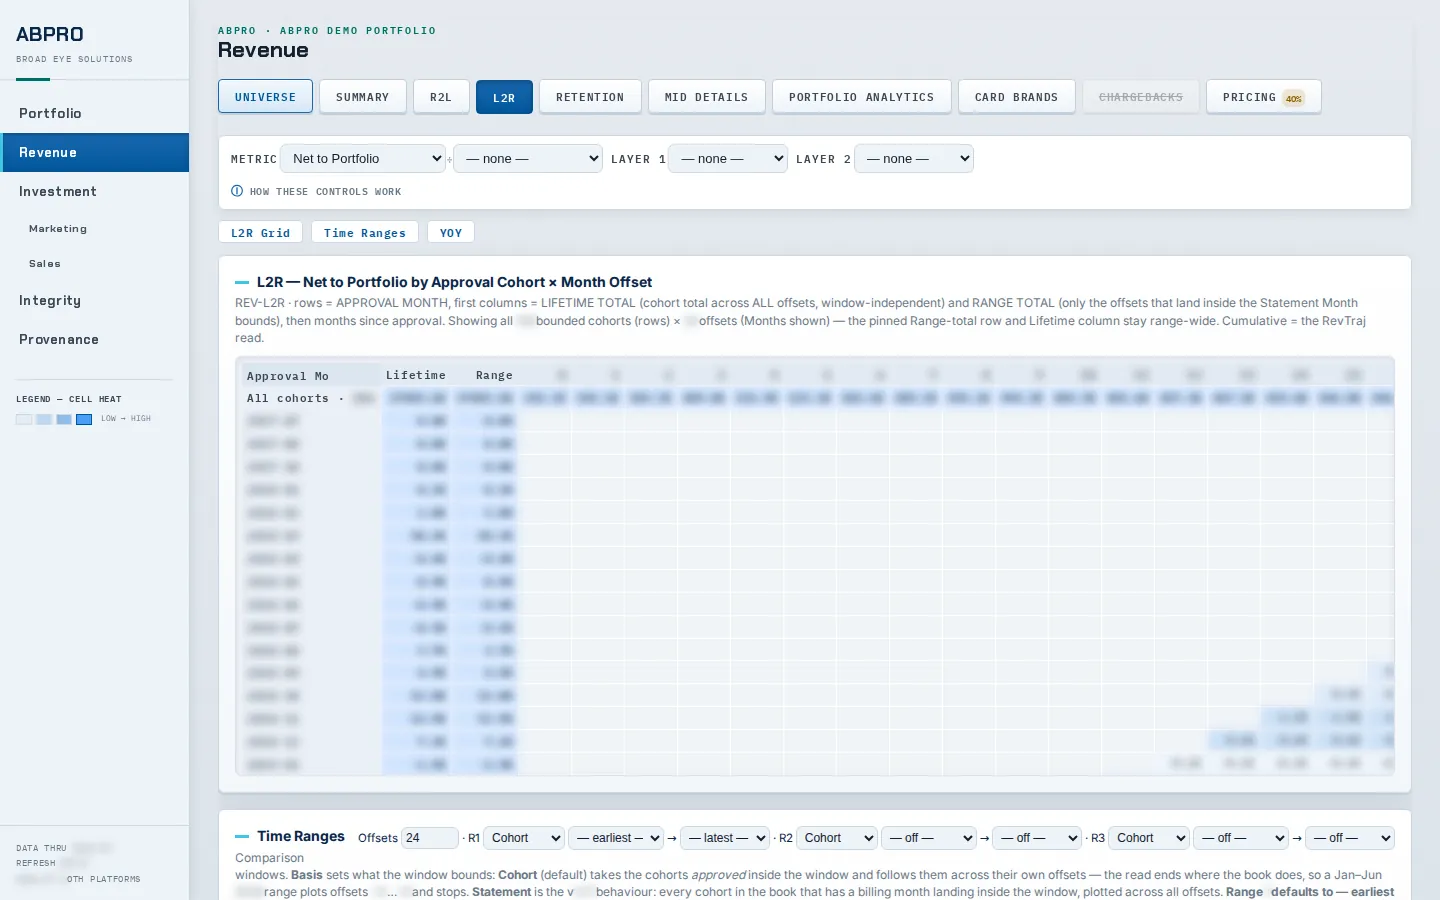
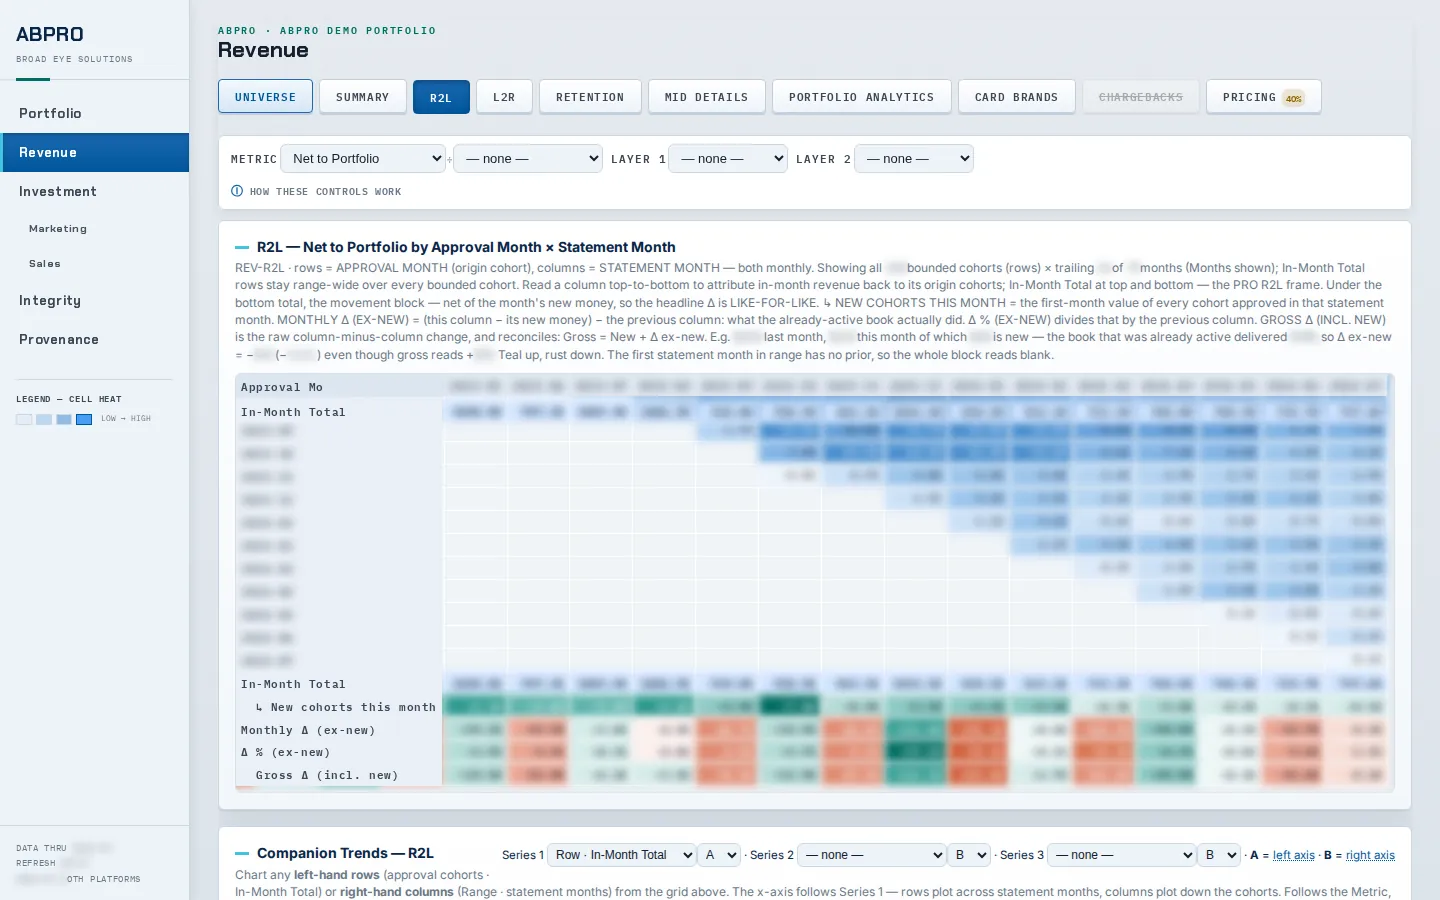
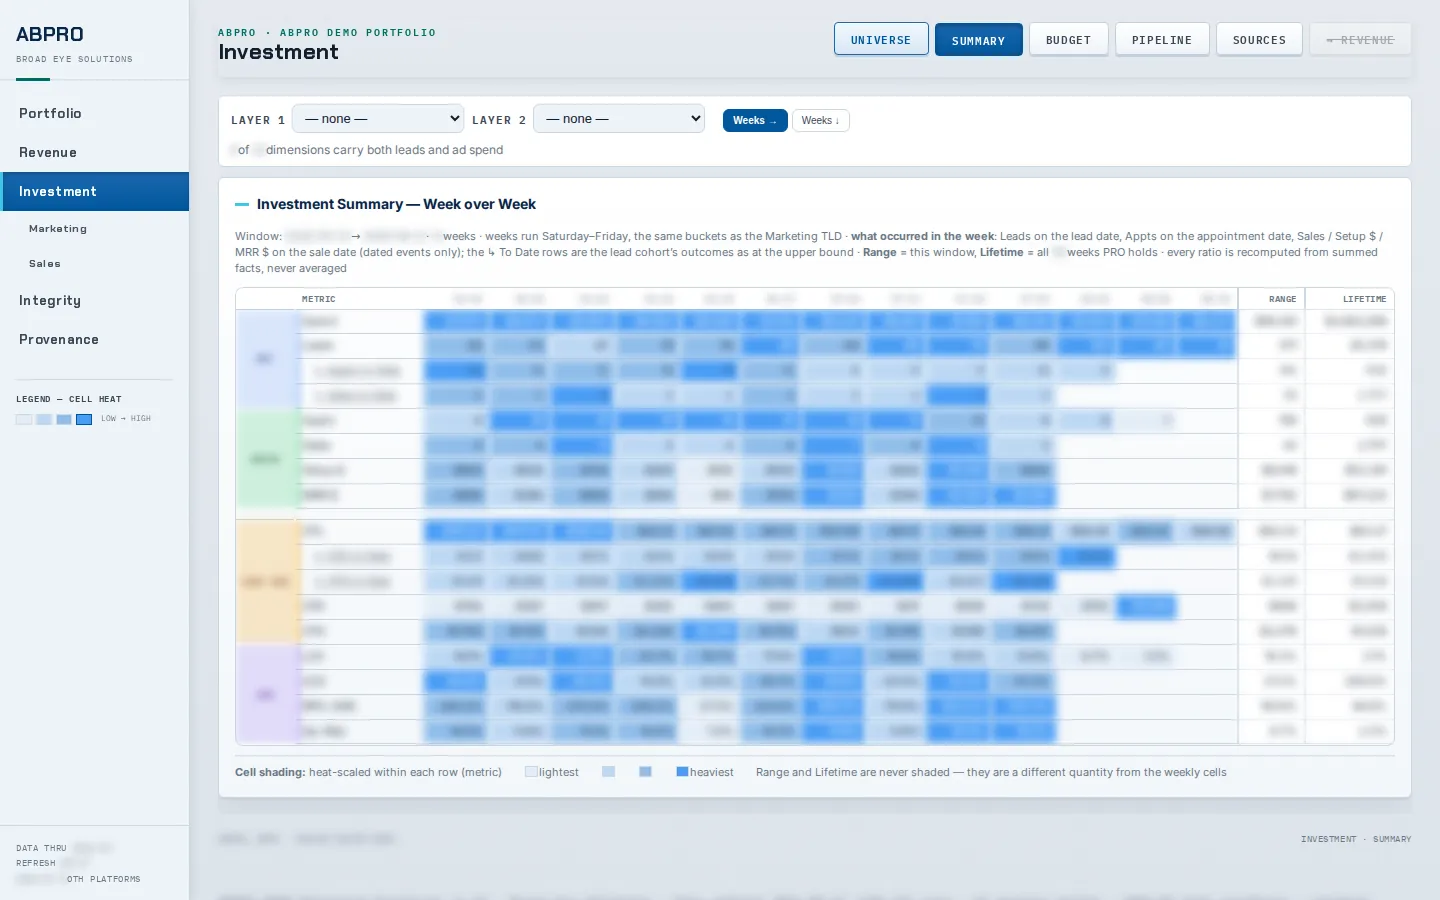
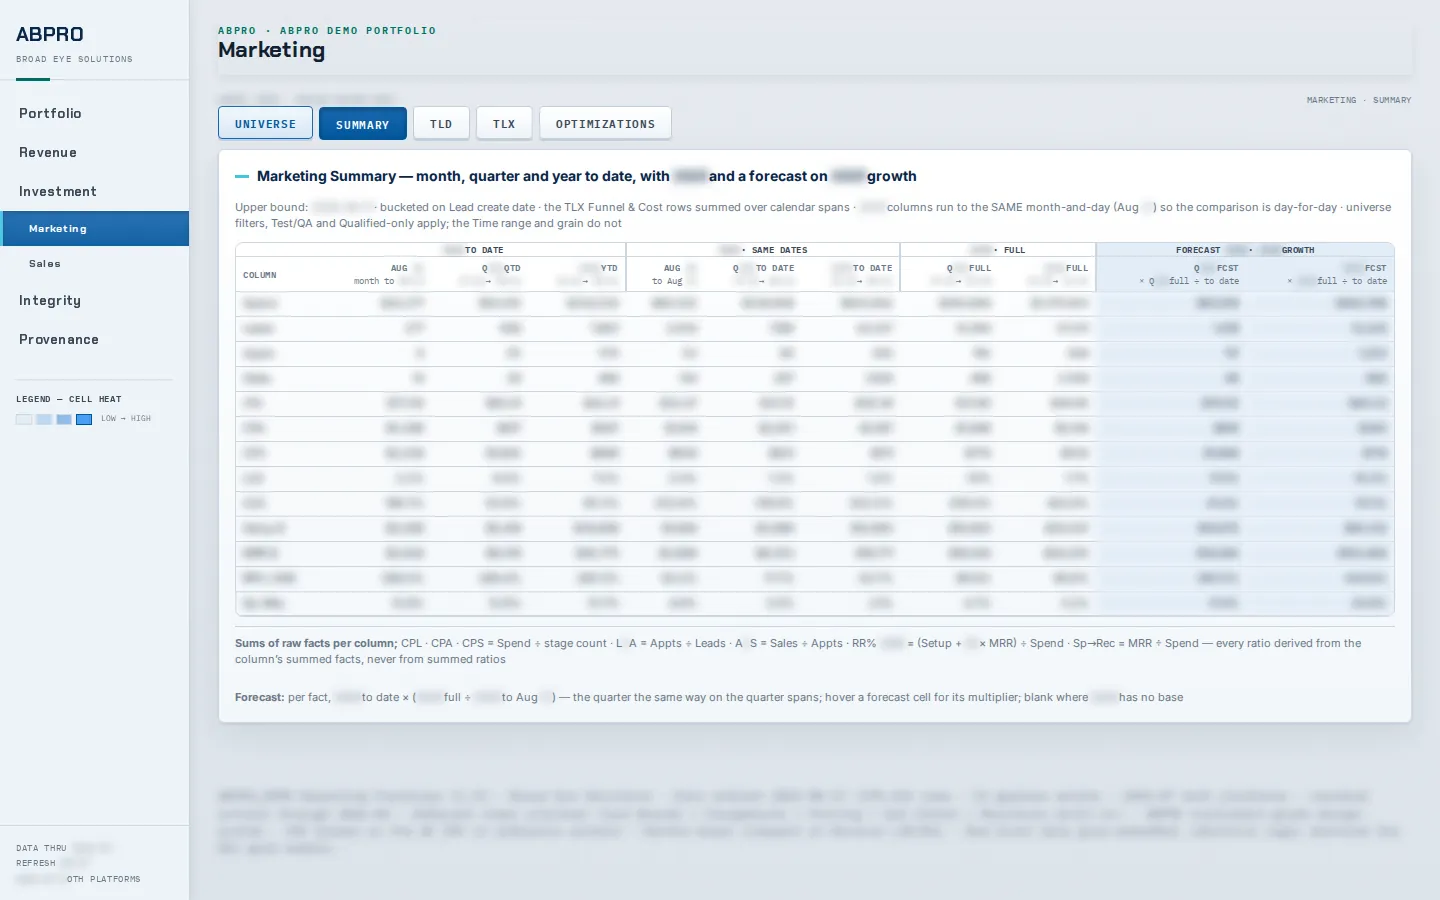
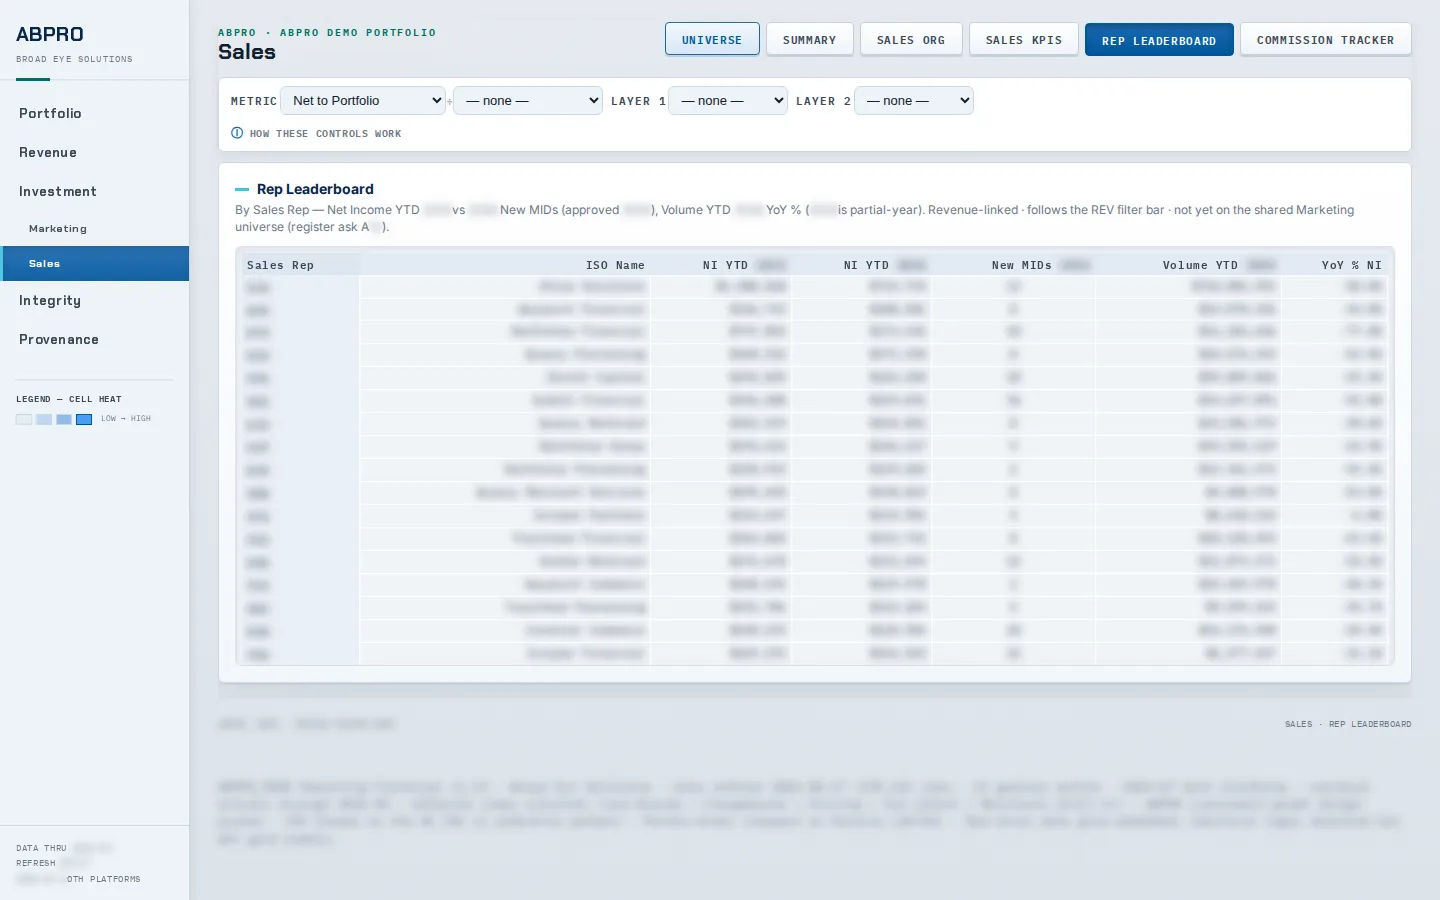
Shown with a demo portfolio. All figures and labels masked.
Built for
Recurring-revenue portfolios.
- Merchant services and payments — ISOs and processors with rep and ISO channels and statement-level residuals.
- Merchant cash advance — funders whose ad spend and funnel data run ahead of their revenue history.
- Other recurring-revenue operators — wherever a small set of accounts carries the book.
Your data, your site
Each client gets its own.
- Its own site — reporting lives at client.abovebaselinepro.com under your site code.
- Its own sign-in — accounts belong to your organization and open only your site.
- Its own database — each client’s data sits in a separate Snowflake database.
Get started
See it on your own portfolio.
Tell us what you’d like to see and we’ll set up access. Existing clients sign in with their site code.